Agent Observability: From Production Signal to PR
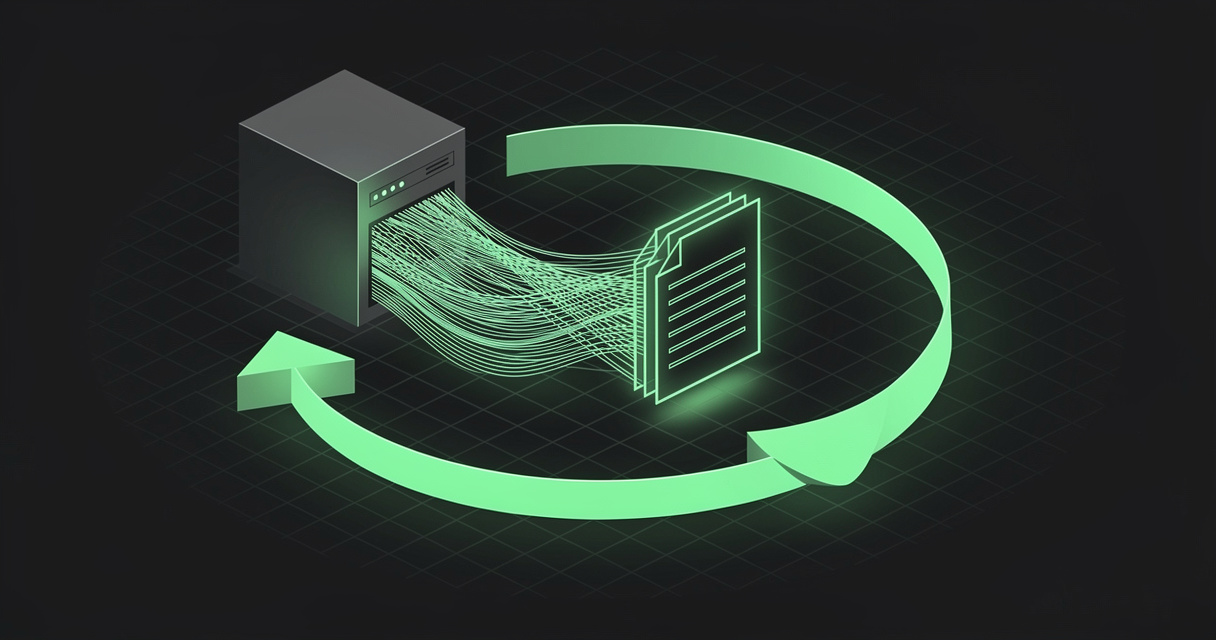
Somewhere in your production traces right now is the evidence for a bug you have not noticed yet. Not a metric that crossed a threshold — the actual sequence of tool calls, prompts and errors that shows what went wrong and where in the code it happened.
Until recently that evidence was useless, because reading it was a human job and no human reads a million spans. That constraint just disappeared, and it takes the entire shape of observability with it.
TL;DR — Agent observability is the practice of recording an AI agent's full decision path as structured traces so failures can be diagnosed rather than guessed at. The shift happening now is who reads them: telemetry has stopped being a dashboard for humans and become fuel for agents that gather evidence, propose a fix and open a PR before anyone looks. The bottleneck moves from writing the fix to trusting it, and the thing that compounds is not the merged PR but the written record of what failed and why. MDflow is a markdown workspace where that record lives — agent-readable over MCP and an HTTP API, versioned, and attributable to the token that wrote it.
What is agent observability?
Agent observability is an inspectable record of how an agent reached an outcome, not just what the outcome was. Where a traditional APM trace records a request hopping between services, an agent trace records the decision layer: each tool call and its arguments, the prompt and the retrieved context that produced it, the model's output, retries, token cost, latency and errors — all nested into the shape of the run.
The reason this needs its own category is that agent failures are not exceptions. Nothing crashes. The agent calls the wrong tool, calls the right tool with a subtly wrong argument, loops on a to-do list it cannot complete, or answers fluently and incorrectly. A 200 response and a green dashboard are perfectly compatible with an agent that has been quietly wrong for a week.
Evals sit on top of the traces as a second layer. An LLM-as-a-judge evaluator runs over production spans and annotates them — this response was unsafe, this one missed the user's intent, this one leaked a prompt injection. As Jason Lopatecki, co-founder and CEO of Arize AI, put it in his AI Engineer talk in July 2026: you tend to build an eval for a failure you have already seen. Evals are institutional memory of past failures, expressed as code that runs continuously.
A note on the term "observability 2.0", because two people mean two different things by it. Charity Majors of Honeycomb coined it for a storage argument: one source of truth made of arbitrarily wide structured events, with metrics and traces as derived views, replacing the three-pillars split. Lopatecki uses the phrase for an audience argument: the consumer of telemetry is becoming a coding agent rather than a person clicking a graph. Both are happening, and they reinforce each other — wide events are much better input for an agent than three disconnected pillars.
Why observability stopped being for humans
The limit on how much you instrument was never storage. It was attention. Teams under-instrument deliberately, because a log line nobody will ever read is noise on a dashboard and a line item on a bill. You log the things you expect to need.
Once an agent is the reader, that calculation inverts. Lopatecki's version is blunt: you are going to trace ten times more and log ten times more than you do today, because telemetry is the smoke thrown off by your system that tells the agent which path through the code it actually took. Without it, the agent is guessing among a million possible paths. With it, the search space collapses to one.
This is why "just add an agent to your monitoring stack" understates the change. The instrumentation strategy changes, the retention strategy changes, and the interface changes — from a UI you click to a set of skills an agent calls. The dashboard does not disappear; it stops being the primary consumer.
The anatomy of a self-improving loop
Lopatecki's talk breaks the loop into four parts. It is worth being precise about each, because the interesting engineering is in the second one.
1. The trigger
Either an event or a schedule. An error class appears in production; an eval score drops; or a job simply wakes every five minutes and reads the recent traces. Nothing exotic — the point is that the loop starts without a human noticing anything.
2. The evidence, gathered by skills
This is the part that decides whether the whole thing works.
An audience member at the talk asked the obvious question: why not just connect Claude Code to your observability data and let it push the PR itself? Lopatecki's answer was yes, you should — followed by the caveat that matters. Making it work well means designing the skill surface deliberately:
- Find the right data. Not "all traces" — the group of traces belonging to one session, one error class, one customer cohort.
- Get it into the repository as files. In his words, these harnesses are magical with files. Arize's skills pull production traces down as temporary files inside the repo — sometimes ten megabytes of them — so the agent reads evidence and code in the same place, with the same tools.
- Make the skills composable. A Pyroscope skill that finds memory issues, a facet skill that cohorts by customer, an eval skill that pulls aggregate judge scores off the traces. The agent chains them.
The distinction is between handing an agent an API and handing it a workspace. Coding harnesses are extraordinarily good at reading, grepping and cross-referencing files; they are much worse at exploring an unfamiliar query interface. Materialising the evidence as files is the whole trick.
3. The harness and the sandbox
The loop is the thing you already do locally, running somewhere else. Same harness — Claude Code, Codex, whatever you use — same skills, same repo, but triggered by an event and executed in a sandbox rather than on your laptop.
The sandbox choice turns out to be a governance question rather than a convenience one. Arize's customers, Lopatecki noted, are frequently large enterprises that will happily install a sandbox inside their own VPC but will not connect their production database to a third-party inference provider. The debugging environment needs access to production systems, which means the debugging environment has to sit where production sits. Get it working locally first, then move it.
4. Review — and the inverted workflow
Previously: a human investigates, then an agent helps write the fix. Now: the agent investigates before anyone is awake, and a human arrives to a ranked issue with the evidence already attached.
Lopatecki is careful not to oversell this. Small fixes come out as clean one- or two-line patches. Bigger ones need a human to spearhead them over the line — and often to redirect the investigation from where it started. What the loop reliably removes is the cold start: the twenty minutes of finding the right traces, reconstructing what happened and forming a first hypothesis.
The bottleneck moved, and it is not the fix
The scarce resource in this loop is not code generation. It is confidence. Anyone running coding agents daily has felt the same thing: producing a candidate fix is nearly free, and deciding whether it is the right fix to push is where the time goes. You can build at agent speed but you cannot improve your system at agent speed, and the governor is trust.
Every part of the loop above is really an argument about confidence:
- More telemetry narrows the space of explanations, so the diagnosis is a reading rather than a guess.
- Evidence in files means the reviewer can check the agent's reasoning against the same artefacts the agent used.
- An eval created from the failure converts a one-off fix into a permanent regression check — which is the only durable way to buy trust in a non-deterministic system.
- A sandbox you control is what makes it acceptable to point any of this at production at all.
Which raises the question the loop diagram does not answer: after the PR merges, what is left?
What the loop forgets
The pull request closes. The sandbox is destroyed. The ten-megabyte evidence files go with it.
What actually happened during that investigation — that this failure class comes from a to-do-update race condition, that the first two hypotheses were wrong and why, that the fix was narrow because the broad version breaks a customer integration — exists nowhere except in a diff and a transcript nobody will read again.
Three months later the same failure class reappears in a slightly different form, and the loop starts cold. It re-derives the reasoning, at full cost, because nothing wrote it down in a place the next run will look.
This is the same pattern that shows up everywhere agents are put to work at scale. In data engineering, teams pay two, three, four times for the same derived dataset because nobody recorded that it existed. In long-running control loops, the only thing the agent knows on run 47 is what somebody wrote into the skill and the feedback file. The durable layer is always prose, and it is always the layer that gets skipped because it is not what the tooling produces by default.
For a self-improving observability loop, the artefacts worth keeping are specific:
- A failure taxonomy — the classes you have actually seen in production, with a canonical example trace ID for each.
- Incident write-ups — what the signal was, what the evidence showed, what was tried and rejected.
- Eval definitions and their provenance — which evaluator exists, and which incident caused it to be written. An eval with no explanation is a check nobody dares delete.
- Skill and runbook corrections — the standing instruction that stops the next investigation from repeating a wrong turn.
- The known-and-accepted list — the failures you have decided not to fix, so the loop stops re-reporting them.
None of that belongs in a dashboard, and none of it survives in a sandbox.
Which applications benefit most
- Customer-facing assistants and support agents — high volume, subjective quality, and failures that never raise an exception.
- Agentic coding and DevOps platforms — the loop is short and the artefacts are already files, so the payoff arrives fastest here.
- Voice agents — sessions are long, failures are timing-dependent, and replaying a transcript is the only way to see what went wrong.
- Regulated industries — finance, healthcare and insurance, where an auditable record of what the agent did and why it was changed is a compliance requirement, not a nice-to-have.
- Multi-agent and swarm systems — with dozens of agents running on schedules, the only tractable interface is one that ranks issues for you.
- Retrieval-heavy applications — where the failure is almost always in which context got assembled, a question only a trace can answer.
How MDflow fits
MDflow is not an observability platform. It does not ingest spans, run evaluators, or store traces — Arize, Phoenix, LangSmith, Braintrust, Honeycomb, Datadog and your OpenTelemetry collector do that, and should. Traces are high-volume machine data with a retention policy, and they belong in a system built for them.
MDflow is where the loop's conclusions live: the failure taxonomy, the incident write-ups, the eval provenance, the runbooks the next agent reads before it starts guessing. That is a document problem, and it is the layer most teams leave in a Slack thread.
What already lines up today
Markdown documents are the native unit. An incident write-up an agent produces is the same markdown you would commit to a repository — no block model, no conversion step. Every document is also served as a raw .md twin with YAML frontmatter, so a sandboxed agent can fetch one over plain HTTP without a client library, which matters when the sandbox has a narrow egress allowlist.
Folder descriptions carry the intent. Every folder has a description saying what belongs in it, and mdflow_get_context ranks those descriptions above folder names and document titles before returning matching bodies. A folder described as "Production failure classes for the support agent — one document per class, with a canonical trace ID, the eval that catches it, and what we decided not to fix" is a retrieval signal you wrote on purpose, not one the model inferred from a filename. That is why folder descriptions beat file names.
Every runtime reads and writes the same workspace. The same documents are reachable from Claude, ChatGPT, Cursor and Codex over the remote MCP server with OAuth or a Personal Access Token, and from a cron job, a CI workflow, an orchestration DAG or an n8n automation over the HTTP API with a bearer token — plus a local stdio server, a VS Code extension and an iOS app. The scheduled loop that files an incident and the engineer who reviews it on a phone at 23:00 are looking at the same document.
The Document Log answers "which run wrote this?" A cross-document activity feed records created, edited, shared and deleted events with the actor on every row, shown as automated · <token name> for anything arriving through the API or MCP. Give each loop its own Personal Access Token and the log tells you which scheduled investigation filed which write-up, with a click-through side-panel diff.
Version history shows how the written context drifted. Every saved change across every write path captures the previous version, with line-by-line diffs and non-destructive restore — so when a runbook stops matching reality you can see exactly when it stopped, and revert the edit that broke it. (Pro, private to the document owner, and deliberately not exposed over the API or MCP.)
Open findings as checkbox lines. /tasks aggregates ordinary - [ ] lines out of every markdown body, so "add an eval for the streaming-cancel class" written by an overnight loop becomes something a human can re-order and tick off, with the document itself remaining the source of truth.
Sharing without granting platform access. A failure write-up can be shared as a read-only link or a .md endpoint so a partner team — or a vendor's support engineer — can read what happened without an account or access to your traces. Collections group several documents into one shareable set, and client-side encryption keeps chosen documents opaque to any agent without the password, which is the right default for anything containing customer data pulled out of a trace.
Where we are headed
Direction, not a dated commitment. Two things about this use case interest us most. The first is richer structured retrieval over folder descriptions, so an agent asking about an error class reliably surfaces the three relevant write-ups out of four hundred rather than the three most lexically similar. The second is narrower agent credentials: a Personal Access Token today reads and writes everything its owner owns, which is good enough for attribution but is not least privilege — and an unattended loop running in a sandbox is exactly the case that wants a token scoped to one folder. Neither turns MDflow into an observability platform, and that is deliberate.
The bottom line
Observability changed audience. The consumer of your traces is becoming an agent, which means you should instrument far more than you used to, materialise evidence as files rather than API responses, and expect to wake up to investigated issues instead of raw alerts. The bottleneck moves from writing the fix to trusting it, and every good practice in the loop is really a mechanism for buying that trust.
But a loop that only produces pull requests is not self-improving — it is self-repeating. The PR closes and the sandbox dies. What makes the loop compound is the written record: what failed, what the evidence showed, which eval now catches it, and what you decided not to fix. Keep that somewhere every agent and every teammate can reach.
Start free · Connect an AI agent · Read the API docs
Frequently asked questions
What is agent observability?
Agent observability is the practice of instrumenting an AI agent so that every step it took is recorded — tool calls, prompts, retrieved context, model outputs, latency, cost and errors — as structured traces rather than just a final response. Unlike traditional application monitoring, which tells you that a request failed, agent observability tells you which path through the agent's decision-making produced the failure, which is the only thing that makes a non-deterministic multi-step system debuggable at all.
What does "from signal to PR" mean?
It describes a loop in which a production signal — an error, a failing eval, a scheduled scan of recent traces — triggers an agent that gathers the relevant telemetry, reads it alongside the repository, and opens an issue or a pull request before a human looks at the problem. Jason Lopatecki, co-founder and CEO of Arize AI, presented this loop at AI Engineer in July 2026 as the anatomy of a self-improving agent. The human's job moves from responder to reviewer.
Why do teams log and trace more once agents read the telemetry?
Because the old limit on instrumentation was human attention. Teams under-instrumented on purpose, since nobody can dig through logs that verbose and extra volume is just noise on a dashboard. An agent has no such limit, so the calculation inverts: the more of the code path you record, the less the agent has to guess about which of a million possible paths the software actually took.
Why not just point a coding agent at your observability data?
You should, but pointing is not enough. Asked exactly this at AI Engineer, Lopatecki said the answer is yes — and that making it work well requires designing the skill surface: finding the right group of traces, writing them into the repository as files the harness can read, and making the skills composable enough that the agent can cohort, filter and drill down. Coding harnesses are extremely good with files and much worse with an unfamiliar query API.
What should a self-improving agent loop write down?
The parts that outlive the pull request: what the failure class was, which evidence proved it, which eval was created so it is caught next time, and which skill or runbook was corrected. The PR merges and closes, and the evidence files usually die with the sandbox that produced them, so unless the reasoning is written into a durable, agent-readable document the next occurrence starts cold again.
Further reading
- From Signal to PR: Anatomy of a Self-Improving Agent — Jason Lopatecki, Arize AI, at AI Engineer (July 2026)
- Arize AX — the managed platform Signal ships in, and Phoenix, the open-source tracing and eval project
- arize-skills — agent skills for datasets, experiments and traces via the
axCLI - It's Time to Version Observability — Charity Majors on the other meaning of "observability 2.0"
- Loop engineering: control loops for coding agents — how to keep an autonomous loop reviewable
- The AI agent harness era — everything around the model that decides whether it works
- Data harness for AI agents — the same "remember or pay twice" argument from the data side
- Provenance for AI agent memory — why "where did this come from" is harder than it looks
- MDflow MCP documentation and HTTP API documentation